
Hello everybody and welcome back to another week of MedTech Compliance Chronicles! Today we will be dealing a little less directly with official regulation, but nevertheless today’s topic is of critical importance when trying to comply with regulation, that is: sampling. At some point in processes of design, V & V, transfer to production, market applications, internal audits and inspections, you are pretty much guaranteed to encounter a degree of sampling activities throughout the manufacture of medical devices. Despite this fact, inadequate sampling procedures are a very common source of problems with all of these activities. Further, sampling inadequacies often call into question the validity of the entire activity for which the sample is being taken, so, for example, if FDA does not believe your sample sizes are adequate for your process validation, your process is not really validated, regardless of how great the design and results might have been.
The concept of sampling is quite broad and, as it is not a series on statistics, the scope will be limited to understanding two very commonly encountered aspects of sampling in the medical device industry. These two aspects will be the use of lot-by-lot inspection tables (often referred to as AQL sampling) and sampling considerations for validations. If an organization can get these types of sampling up to par they will be at a great advantage in terms of compliance and also gain actually useful information about their product and processes instead of just checking regulatory boxes.

Lot-to-Lot (AQL) Sampling
Lot-by-lot sampling plans are very widely used in most manufacturing industries, very often for inspection of incoming product by suppliers but also for in-process and even final inspections, where the product is made in lots/batches. As discussed in a prior post, there are numerous standards around this concept that give pretty easy to follow tables which clearly display your necessary sample sizes for various scenarios. It was also discussed that these tables are very often misused and not well understood. Therefore, in this section, we will try to clear up a lot of the misconceptions around AQL based sampling schemes and how to use them correctly.
The first thing to clear up is the very meaning of AQL, Acceptance Quality Limit. A common mistake is to assume that the designated AQL is the designated quality of the lot. So, for example, let's say you have an AQL of 10%, then this interpretation would mean that each lot contains roughly 90% passing items and 10% defective items. This is not the correct meaning of the term. A designated AQL means that, on average, lots with up to 10% defective items have a high chance (usually >90%) of being accepted by the sampling scheme, while lots with greater than 10% defective have a lesser chance of acceptance. The lower the quality of the lot the higher the chance of rejection, however, there is no guarantee that a lot which passes an AQL inspection has the designated AQL level of quality. The process of setting an AQL for inspections is therefore a risk based statement to the effect of “I want a high probability of detecting a lot with quality lower than XX% and accept the risk associated with the possibility of accepting worse lots.” So, what is that risk? How do you determine it?
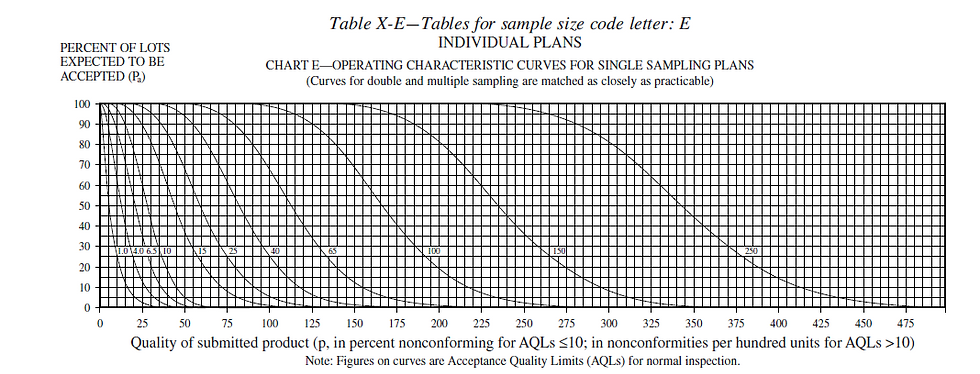
Fundamental understanding of AQL necessarily involves an understanding of the operating characteristic (OC) curve associated with the given sampling scheme. The operating characteristic curves are given in all of the standards that provide such sampling plans. They are a simple graph of the probability of accepting a lot (on the y-axis) versus the quality of the lot (on the x-axis). The quality of the associated lots are given in either % defective or nonconformities per 100 units. You will see in examining these curves that the values of the y-axis (the probability of accepting a lot) are quite high up to the set AQL on the x-axis. Once you move past the AQL on the x-axis, the probability of lot acceptance drops significantly, but does not reach zero until well after the AQL. For example, using the curve below and an AQL of 10 you can determine that, even though you specified an AQL of 10 (correlating to a lot of 10% defective) you still have a 30% chance of accepting a lot of quality as low as 35% defective, further, a 5% chance of accepting a lot of 50% defective.
Careful study of the OC curve for a given sample plan is necessary in the medical device industry to justify the risk you are taking and to give FDA a high degree of confidence that the products you produce conform to regulatory requirements. This becomes a nice segue into another common mistake with AQL based sampling plans, which is declaring a single AQL for all inspections. Everything in medical devices is about risk which usually varies greatly depending on exactly what is being inspected. For example, if you set the same AQL for a circuit board that controls an electrosurgical generator as you do for the buttons that are mounted on that generator, you are likely either over inspecting your buttons (not a compliance issue but a potentially costly business decision) or under inspecting your circuit boards (could be a compliance issue). The same goes for differing quality aspects on the same components. Going back to the circuit board, components or circuits that directly control the power supply might be inspected at a higher AQL than the mounting features of the board. A common way to get around this issue is to designate in one of your SOPs different AQLs for different risk levels, i.e. high risk components/features are to be inspected at a 0.1 AQL, medium at a 1.0 and low at a 10.0.
A final note to clear the air a bit around a very common mistake with AQL based sampling plans - they are for LOT-BY-LOT inspection ONLY. You cannot use these sampling plans for any inspection or test. The calculations they are based on assume continuous lots of product are being received and inspected. They do not hold up their statistical validity in one-off scenarios. For example, you cannot be designing a protocol for a process validation and say “my typical lot size is about xxx” and then go to ANSI Z1.4 (or whichever other standard you use) and find a table that gives a sample size corresponding to that lot size and assume that to be an adequate sample size for your process validation. So, since validations are another very common place where statistical sampling is performed in industry, how do you go about that?
Sampling for Validation
Validations are by far the second most common task in medical device manufacturing requiring statistical sampling. Whether you are validating the product, process or software, the overall goal is to “prove” with a high degree of confidence that the thing being validated is adequate for its intended function. If you think about it, this is necessarily a sampling exercise. In order to provide confidence of adequacy you must inspect or test whatever is being validated until you have the needed level of confidence. The question becomes, how much of what to test?
We will first address the question of what to test. The statistical concept of stratified sampling comes into play here. Stratified sampling separates the inputs and outputs of the validation into logical categories (i.e. largest, smallest, sharpest angle, most/least material, etc.). If you were to randomly sample from all inputs and outputs of the process, you might get an even mix of all of these differing categories. However, it is often not the case that every category holds equal risk or is equally likely to exhibit issues. Therefore, it is common practice to justify a few “worst-case” categories and perform your validation with those categories, justifying in your protocol that if these categories are validated, all others are as well. For example, if you are validating a heat sealing process for sterile pouches and you have 12 total different types of pouches. Of these 12 types there are two different materials and all of the other differences are simply to the sizes of the pouches. Then you might make the justification that you will test both the largest and the smallest pouch from each type of material. The largest and the smallest represent the worst cases, the most extreme aspects the process will encounter for that type of material. Therefore, if all testing passes on both the largest and the smallest, then it can be reasonably assumed that the process is also validated for all sizes in between. You would of course have to do this for both types of material, since passing results on one tell you nothing about the other, even if the pouches are the same size. Still, this reduces the number of categories from which you need to sample from 12 to four. The same concepts apply to anything that must be validated. You select the worst (sometimes called edge) cases on each “book-end” of the process, validate them and consider everything in between validated. For software, your categories might be grouping software tasks together and evaluating the most difficult groups of tasks for the software to perform. Often the most difficult part of all of this is adequately justifying what constitutes worst cases. Unfortunately, there is no replacement for subject matter expertise in that, and it is not uncommon to have a meeting with a consultant for at least determining the worst cases if the expertise does not exist internal to the organization.
Naturally, the next question will be, great, now how many from each of these worst case categories must I test? Unfortunately, this is not necessarily a place where there is a lot of consensus on how to determine this. However, there are some very good methods that generally hold up to FDA inspection. Here I will describe a method using the binomial distribution and some concepts from reliability engineering. In my experience, this has the most statistical validity of the methods I have seen. There are other methods out there but also remember that non valid sampling is the most common issue with validations in general, so be sure you can strongly justify whichever method has been used to determine your sample.
The binomial distribution is a probability distribution that describes the probability associated with anything that only has two outcomes. All inspections and tests can ultimately be evaluated binarily, either pass or fail, so the binomial distribution is an excellent choice for evaluating the results of inspections and tests. The word given to the probability that the outcome passes is the “reliability” of the outcome. As with all real things in life, nothing can ever be known with 100% certainty, so some type of confidence must be given to this reliability value. The confidence used is the standard confidence levels from any type of statistical hypothesis testing; you might have seen it in the form of 1-alpha, where alpha is your risk of being incorrect. It is a general standard, in both statistics and the medical device industry, to set alpha to 5% or 0.05, which in turn gives you a 1-0.05=0.95 or 95% confidence that your results are accurate. These two concepts lead to a very simple formula to calculate the necessary sample size for any desired reliability and confidence levels:
ln(1- desired confidence)
n=-----------------------------------
ln(desired reliability)
Of note, this formula rarely gives whole numbers and, regardless of the decimal size, you must always round up to maintain the desired confidence in your results. Now, we have stated that the confidence level is usually set at 0.95 for most purposes, but what about the reliability? Much like choosing AQL levels, this is going to be based on the risk of exactly what is being validated. It is common practice at many organizations to set reliability equal to 0.90 for low risk items, 0.95 for medium risk and 0.99 for high risk, which equate to some “standard” sample sizes you might have seen before of 29, 59 and 299. What this actually means is, if you test 29 samples and have zero failures, then you can be 95% confident that the item in question has at least a 90% reliability. This brings us to another point, that this formula, and indeed this method period, does not allow for any failures in the sample. Allowing for failures just increases the sample size required for the same reliability, so it is usually best to use the zero failure model unless you expect a high rate of failure (which might cause FDA some heart ache).
The method described above provides the necessary sample sizes of a particular item (product, software function, etc.) to test. For software and product validation, this is generally all that is required. For processes, the thought might have already occurred “I have a process that manufactures several hundred devices in a single run, does this mean I just have to test 29, 59 or 299 of them and call the process validated after a single run?” The short answer is no, it does not. A rule of thumb for many years in the industry, and in the 90’s FDA even used to support it, is that you must have passing results from at least three process runs to consider the process validated. There is even an old saying “once is luck, twice is chance, three times is validation.” However, FDA moved away from this thinking in the early 2000’s, even if most of the industry has not caught up yet. In reality three is the minimum, but you must introduce all possible sources of variation to the process and prove that in all cases, it produces acceptable results. If you have one Monday-Friday shift with the same personnel working the same processes, then three runs are probably adequate. However, if your operation runs 24/7, this likely involves at least 6 shifts (3 shifts in the regular work week and 3 for the weekend workers) and so you would need to run the process at least 6 times (one per shift) to ensure that it produces acceptable results under all conditions it will be run at in actual production. The same can also be said for different manufacturing locations, different production lines running the same process and even different seasons of the year, if process conditions change considerably with the season, i.e., processes affected by things like ambient temperature, humidity levels, etc., where those things are not kept in constant control by the manufacturer.
Conclusion
This has been quite a long post already and so much more could be said on the topic of statistical sampling in the medical device industry. The goal of this post was to cover the vast majority of the cases in which sampling is used in industry in as short and simple a package as possible. More importantly, to give a fundamental understanding of where the sample sizes come from rather than a table that says “if your lot size x test x samples.” I hope you have gained a better understanding of what it means to establish an AQL. That it is inherently a risk based metric and not a guarantee that the quality always equals the AQL. Further, you should now be able to calculate the required sample size for any degree of reliability at any confidence level of your choosing and be able to talk to an auditor logically about the statistical meaning and validity behind the sample size.
Comments